5 Steps for Migrating from Elasticsearch to Rockset for Real-Time Analytics
November 2, 2022
Nothing to Fear
Migration is often viewed as a 4 letter word in IT. Something to avoid, something to fear and definitely not something to do on a whim. It’s an understandable position given the risk and horror stories associated with “Migration Projects”. This blog outlines best practices from customers I have helped migrate from Elasticsearch to Rockset, reducing risk and avoiding common pitfalls.
With our confidence boosted, let’s take a look at Elasticsearch. Elasticsearch has become ubiquitous as an index centric datastore for search and rose in tandem with the popularity of the internet and Web2.0. It is based on Apache Lucene and often combined with other tools like Logstash and Kibana (and Beats) to form the ELK stack with the expected accompaniment of cute elk caricatures. So popular still today that Rockset engineers use it for our own internal log search functions.
As any prom queen will tell you, popularity comes at a cost. Elasticsearch became so popular that folks wanted to see what else it could do or just assumed it could cover a slew of use cases, including real-time analytics use cases. The lack of proper joins, immutable indexes that need constant vigil, a tightly coupled compute and storage architecture, and highly specific domain knowledge needed to develop and operate it has left many engineers seeking alternatives.
Rockset has helped to close the gaps with Elasticsearch for real-time analytics use cases. As a result, companies are flocking to Rockset like Command Alkon for real-time logistics tracking, Seesaw for product analytics, Sequoia for internal investment tools and Whatnot and Zembula for personalization. These companies migrated to Rockset in days or weeks, not months or years leveraging the power and simplicity of a cloud-native database. In this blog, we distilled their migration journeys into 5 steps.
Step 1: Data Acquisition
Elasticsearch is rarely the system of record which means the data in it comes from somewhere else for real-time analytics.
Rockset has built-in connectors to stream real-time data for testing and simulating production workloads including Apache Kafka, Kinesis and Event Hubs. For database sources, you can use CDC streams and Rockset will materialize the change data into the current state of your table. There is no additional tooling needed like in Elasticsearch where you have to configure Logstash or Beats along with a queueing system to ingest data.
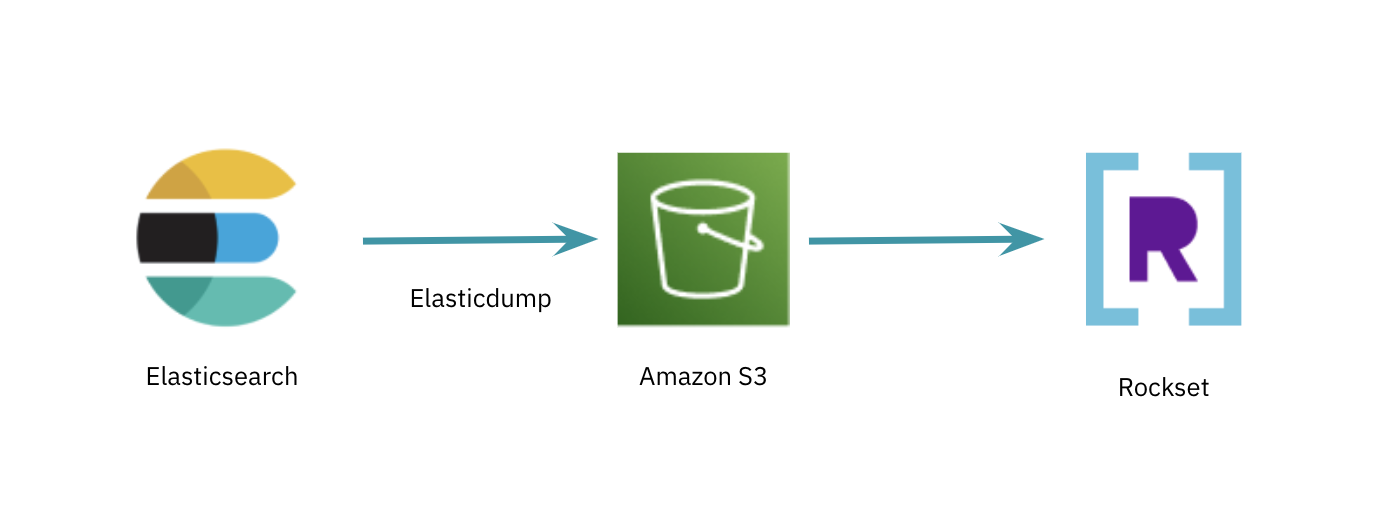
However, if you want to quickly test query performance in Rockset one option is to do an export from Elasticsearch using the aptly named elasticdump utility. The exported JSON formatted files can be deposited into an object store like S3, GCS or Azure Blob and ingested into Rockset using managed integrations. This is a quick way to ingest large data sets into Rockset to start testing query speeds.

Rockset has schemaless ingest and indexes all attributes in a fully mutable Converged Index, a search index, columnar store and row store. Furthermore, Rockset supports SQL joins so there is no data denormalization required upstream. This removes the need for complex ETL pipelines so data can be available for querying within 2 seconds of when it was generated.
Step 2: Ingest Transformations
Rockset uses SQL to express how data should be transformed before it is indexed and stored. The simplest form of this ingest transform SQL would look like this:
SELECT *
FROM _input
Here _input is source data being ingested and doesn’t depend on source type. The following are some common ingest transformations we see with teams migrating Elasticsearch workloads.
Time Series
You will often have events or records with a timestamp and want to search based on a range of time. This type of query is fully supported in Rockset with the simple caveat that the attribute must be indexed as the appropriate data type. Your ingest transform query make look like this:
SELECT TRY_CAST(my_timestamp AS timestamp) AS my_timestamp,
* EXCEPT(my_timestamp)
FROM _input
Text Search
Rockset is capable of simple text search, indexing arrays of scalars to support those search queries. Rockset generates the arrays from text using functions like TOKENIZE, SUFFIXES and NGRAMS. Here’s an example:
SELECT NGRAMS(my_text_string, 1, 3) AS my_text_array,
* FROM _input
Aggregation
It is common to pre-aggregate data before it arrives into Elasticsearch for use cases involving metrics.
Rockset has SQL-based rollups as a built-in capability which can use functions like COUNT, SUM, MAX, MIN and even something more sophisticated like HMAP_AGG to decrease the storage footprint for a large dataset and increase query performance.
We often see ingest queries aggregate data by time. Here’s an example:
SELECT entity_id, DATE_TRUNC(‘HOUR’, my_timestamp) AS hour_bucket,
COUNT(*),
SUM(quantity),
MAX(quantity)
FROM _input
GROUP BY entity_id, hour_bucket
Clustering
Many engineering teams are building multi-tenant applications on Elasticsearch. It’s common for Elasticsearch users to isolate tenants by mapping a tenant to a cluster, avoiding noisy neighbor problems.
There is a simpler step you can take in Rockset to accelerate access to a single tenant's records and that’s to do clustering on the column index. During collection creation, you can optionally specify clustering for the columnar index to optimize specific query patterns. Clustering stores all documents with the same clustering field values together to make queries that have predicates on the clustering fields faster.
Here is an example of how clustering is used for multi-tenant applications:
SELECT *
FROM _input
CLUSTER BY tenant_id
Ingest transformations are optional strategies that can be leveraged to optimize Rockset for specific use cases, decrease the storage footprint and accelerate query performance.
Step 3: Query Conversion
Query Conversion Elastic’s Domain Specific Language (DSL) has the advantage of being tightly coupled with its capabilities. Of course, this comes at the cost of being too specific for porting directly to other systems.
Rockset is built from the ground up for SQL, including joins, aggregations and enrichment functions. SQL has become the lingua franca for expressing queries on databases of all varieties. Given that many engineering teams are intimately familiar with SQL, it makes it easier to convert queries.
We recommend taking the semantics of a common query or query pattern in Elasticsearch and translating it into SQL. Once you’ve done that for a number of query patterns, you can use the query profiler to understand how to optimize the system. At this point the best thing to do is save your semantically equivalent query as a Query Lambda or named, parameterized SQL stored in Rockset and executed from a dedicated REST endpoint. This will help as you iterate during query tuning since Rockset will store each new version.
Query Tuning Rockset reduces the time and effort of query tuning with its Cost-Based Optimizer (CBO) which takes into account the data in the collections, the distribution of data, and data types in determining the execution plan.
While the CBO works well a good portion of the time, there may be some scenarios where using hints to specify indexes and join strategies will enhance query performance.
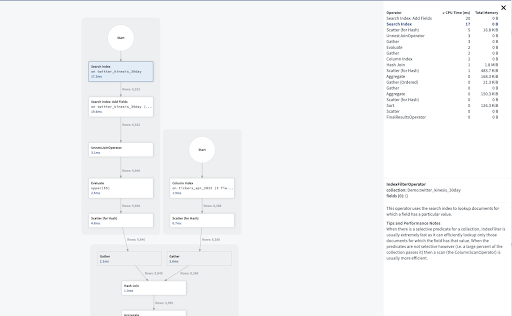
Rockset’s query profiler provides a runtime query plan with row counts and index selection. You can use it to tune your query to achieve your desired latency. You may, in the process of query tuning, revisit ingest transformations to further reduce latency. This will end up giving you a template for future translation that is already optimized for the most part minus substantial differences.

Engineering teams start optimizing queries in the first week of their migration journey with the help of the solutions engineering team. We recommend initially focusing on single query performance using a small amount of compute resources. Once you get to your desired latency, you can stress test Rockset for your workload.
Step 4: Stress Test
Load testing or performance testing enables you to know the upper bounds of a system so you can determine its scalability. As mentioned above, your queries should be optimized and able to meet the single query latency required for your application before starting to stress test.
Being a cloud-native system, Rockset is highly scalable with on-demand elasticity. Rockset uses virtual instances or a set of compute and memory resources used to serve queries. You can change the virtual instance size at any time without interrupting your running queries.
For stress testing we recommend starting with the smallest virtual instance size that will handle both single query latency and data ingestion.
Now that you have your starting virtual instance size, you’ll want to use a testing framework to allow for reproducible test runs at various virtual instance sizes. HTTP testing frameworks JMeter and Locust are commonly used by customers and we recommend using the framework that best simulates your workload.
To compare performance, many engineers look at queries per second (QPS) at certain query latency intervals. These intervals are expressed in percentiles like P50 or P95. For user-facing applications, P95 or P99 latencies are common intervals as they express worst case performance. In other cases where the requirements are more relaxed you might look at P50 and P90 intervals.
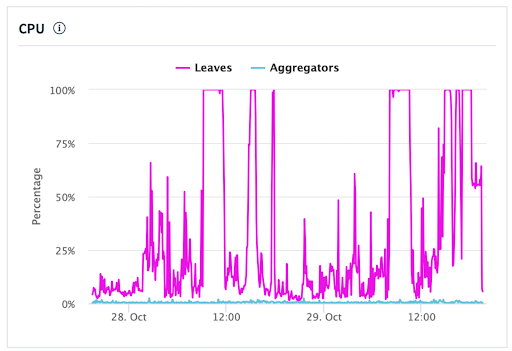
As you increase your virtual instance size, you should see your QPS double as the compute resources associated with each virtual instance double. If your QPS is flatlining, check Rockset CPU utilization using metrics in the console as it may be possible that your testing framework is not able to saturate the system with its current configuration. If instead Rockset is saturated and CPU utilization is close to 100%, then you should explore increasing the virtual instance size or go back to single query optimization.

The idea with stress testing is to build confidence, not a perfect simulation, so once you feel comfortable move on to the next step and know that you can also test again later.
Step 5: Production Implementation
It’s now time to put the Ops in DevOps and start the process of taking what has been up to this point a safely controlled experiment and releasing it to the wild.
For highly sensitive workloads where query latencies are measured in the P90 and above buckets, we often see engineering teams using an A/B approach for production transitions. The application will route a percentage of queries to both Rockset and Elasticsearch. This enables teams to monitor the performance and stability before moving 100% of queries to Rockset. Even if you are not using the A/B testing approach, we recommend having your deployment process written as code and treating your SQL as code as well.
Rockset provides metrics in the console and through an API endpoint to monitor system utilization, ingest performance and query performance. Metrics can also be captured on the client side or by using Query Lambdas. The metrics endpoint enables you to visualize Rockset and other system performance using tools Prometheus, Grafana, DataDog and more.
The Real First Step
We mapped the migration from Elasticsearch to Rockset in five steps. Most companies can migrate a workload in 8 days, leveraging the support and technical expertise of our solutions engineering team. If there is still a hint of hesitancy on migrating, just know that Rockset and engineers like me will be there with you on the journey. Go ahead and take the first step- start your trial of Rockset and get $300 in free credits.